


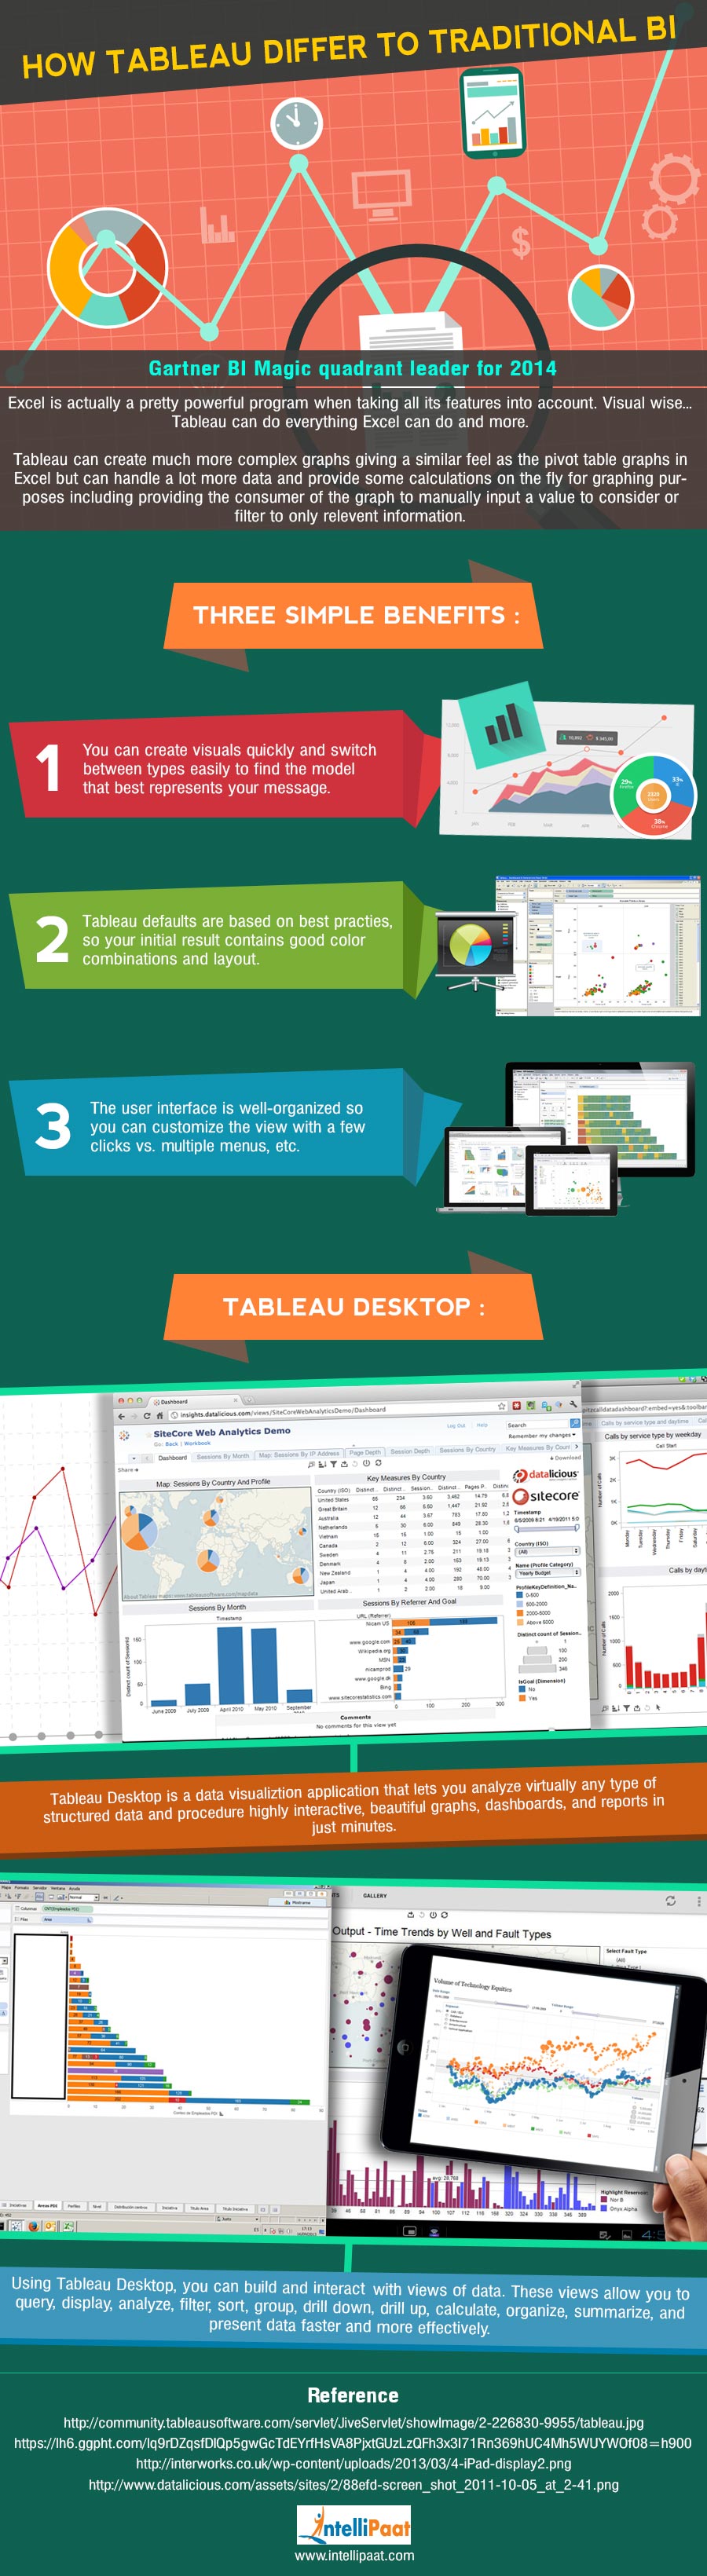
Tableau can create much more complex graphs giving a similar feel as the pivot table graphs in Excel but can handle a lot more data and provide some calculations on the fly for graphing purposes including providing the consumer of the graph to manually input a value to consider or filter to only relevant information.
Source: intellipaat
![]()
Related Posts
Top 25 Python Libraries for Data Science in 2025
January 23, 2025

Understanding Contentious Probate
November 29, 2024